Nikoo Samadi
Inventory sits at the center of every supply chain. Too much stock ties up cash and warehouse space. Too little causes delays and lost sales. Striking the right balance takes more than instinct; it requires visibility and control. Dynamics 365 inventory management provides a unified system to track stock, manage orders, and oversee warehouse operations in real time.
Many businesses rely on scattered systems or manual tracking to manage inventory. These methods create blind spots. Managers react to issues after they happen instead of preventing them.
Microsoft Dynamics 365 Inventory Management helps connect planning, purchasing, production, and sales in one system. It captures every movement of materials and products in real time. Yet data alone is not enough. To make fast and confident decisions, teams need clear insight.
By pairing Dynamics 365 with Power BI, companies can see what is happening, why it’s happening, and what to do next. Together, they turn inventory data into decisions that improve performance and reduce waste.
How Dynamics 365 Supply Chain handles inventory
Effective inventory management begins with a reliable platform. Dynamics 365 Supply Chain Management gives you that platform with built-in inventory capabilities designed for real-time operations.
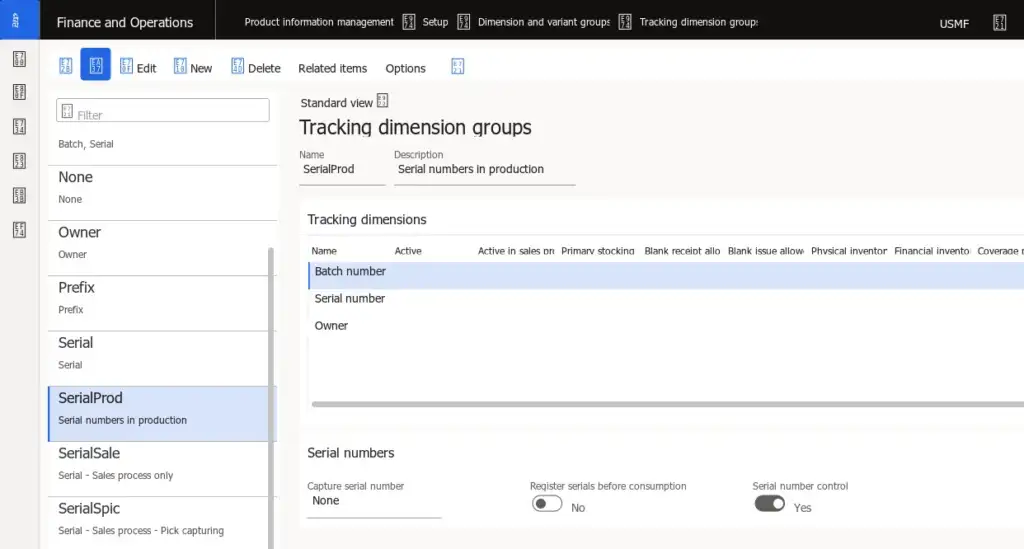
First, the system supports real-time tracking of on-hand stock across sites and warehouses. You can see items as they arrive, move, and ship. Second, it offers advanced inventory control, including tracking by lot, batch, or serial number, and the ability to define multiple storage locations. Third, it connects inventory to wider operations: inbound receiving, quality checks, transfers, and outbound fulfillment.
Another key capability is the Inventory Visibility service. With this add-on you get a unified view of inventory across internal and external channels. It lets you query current stock, monitor in-transit items, and avoid overselling.
Finally, the system supports valuation and costing methods (FIFO, average cost, and standard cost) so you can link physical stock to financials.
Simplify Your Decision with GEM365
Get in touch with GEM365 to guide you through the process and get consultation for free.
The Missing Link — Turning Data into Insight
Even with strong inventory controls, many teams still struggle to see the bigger picture. Data lives in reports, but those reports often arrive too late or lack context. People know what happened but not why.
Dynamics 365 Supply Chain captures huge amounts of operational data — receipts, transfers, adjustments, production, and sales. Yet without a clear view, this information can overwhelm rather than guide. Managers may export data to spreadsheets or chase updates by email, which introduces errors and delays.
This is where Power BI adds value. Power BI connects directly to Dynamics 365 and presents information through interactive dashboards. It turns raw data into visual stories that show trends and patterns. You can spot excess stock, identify items moving slower than forecast, or see where demand is rising.
Instead of relying on guesswork, teams act on evidence. Planners adjust reorder levels based on current movement. Finance teams see the cost tied up in unused stock. Leaders track key metrics in real time.
The link between Dynamics 365 and Power BI closes the gap between data collection and decision-making, giving companies insight they can use every day.
Using Power BI with Dynamics 365 for Inventory Optimization
When you combine Dynamics 365 Supply Chain Management (D365 SCM) with Power BI, you gain more than just data collection, you gain actionable insight. This section explains how the two tools work together to optimize inventory.
Integration and data flow
D365 SCM gathers inventory data (on-hand levels, items in transit, reorder points, demand forecasts). These data flow into Power BI, often via the Inventory Visibility dashboard or directly from D365 entities. For example, Microsoft notes that the Inventory Visibility Power BI dashboard lets you “track inventory levels across regions, entities, and channels … identify out-of-stock, under-stocked, and over-stocked products”.
Because Power BI can refresh frequently, the dashboard becomes a live window into your inventory condition. If stock falls below the threshold or demand spikes, you’ll see it. This turns inventory from a passive asset into a managed resource.
Optimisation: spotting patterns, trends and risks
With the combined setup you can:
- Monitor slow-moving items and excess stock. D365 SCM lists features such as advanced inventory control, forecasting, and multi-warehouse management.
- Use Power BI to visualize KPIs like turnover ratio, days of inventory, and stock-out rates. Research and best-practice guides highlight that dashboards should surface these metrics clearly.
- Automate replenishment triggers. As an example, one source describes how D365 SCM uses embedded Power BI dashboards to “track KPIs such as stock turnover, replenishment cycle time, and fulfillment rates,” and then uses that insight to automate purchase or transfer orders.
Practical steps
To use these tools for inventory optimization:
- Define your inventory metrics: Decide what counts, for example, days of inventory, on-hand value, and slow-moving percentage.
- Connect D365 SCM to Power BI: Use the Inventory Visibility data model or set up your own queries. Microsoft gives detailed instructions.
- Build meaningful dashboards: Keep visuals simple. Show only key metrics. Use clear filters (e.g., by product line, region, or warehouse). Best practice suggests focusing on clarity and actionable insights.
- Set alert-triggers and workflows: When a KPI crosses a threshold (e.g., stock-out risk > 10%), trigger a replenishment workflow in D365 SCM.
- Review & refine: Use the insights from Power BI to adjust reorder points, safety stock, or supplier lead times. Over time, your system becomes more responsive and less reactive.
Building Actionable Dashboards
A dashboard should answer questions, not raise new ones. The goal is to show what matters most, not everything at once. In inventory management, clarity beats complexity.
Power BI offers flexible tools to build dashboards that connect to Dynamics 365 Supply Chain data. Microsoft recommends defining your key performance indicators (KPIs) first, metrics such as on-hand value, turnover ratio, and stock-out rate.
An effective dashboard groups related visuals together. For instance, one panel can show stock health (days of inventory, replenishment lead time), while another tracks demand trends. Use filters for product lines, warehouses, or regions so users can focus quickly. Industry examples suggest using color sparingly: green for stability and red for risk.
Context is critical. Combine quantity data from Dynamics 365 with financial data, such as cost of goods sold, to show the impact of each decision. A Power BI model can join inventory tables with sales or purchasing data through common fields like item number or warehouse ID.
Keep visuals interactive but simple. Every chart should support a clear action, adjust reorder levels, review supplier performance, or shift stock. A good dashboard turns data into a calm, confident guide rather than a wall of numbers.
Case Example: Dynamics 365 Inventory Management in Action
Consider a mid-sized manufacturing company that produces packaging materials. The firm runs six production lines and manages raw materials across three warehouses. Before using Dynamics 365 Supply Chain Management (D365 SCM) and Power BI, inventory decisions were made through spreadsheets and monthly reports. Delays led to frequent stock-outs of key inputs such as resin and additives.
After implementing D365 SCM, every goods receipt, transfer, and production issue was recorded in real time. This data fed directly into Power BI. Using Microsoft’s Inventory Visibility dashboard template, the operations manager built a live report showing on-hand stock, items in transit, and open purchase orders.
Within weeks, the team began to spot clear trends. Certain suppliers often shipped late, creating hidden shortages. The Power BI view showed how these delays increased production downtime. By linking the dashboard to supplier performance data, managers could see which vendors caused the most disruption.
They used these insights to adjust reorder points and add buffer stock for high-risk materials. Over three months, material stock-outs dropped by 40 percent, and warehouse carrying costs fell by 12 percent.
The lesson was simple: when information flows clearly, small daily decisions add up to major operational gains.
Benefits That Matter
The real value of connecting Dynamics 365 Supply Chain Management with Power BI lies in the results teams see day to day. Companies that build visibility into their inventory report lower costs, faster response times, and more predictable operations.
According to Microsoft documentation, Dynamics 365 provides “a single source of real-time inventory truth across all locations and channels.” When this data feeds into Power BI, it becomes a decision tool rather than a record-keeping system.
- Reduced carrying costs. Power BI dashboards make it easier to identify slow-moving or excess stock. Managers can adjust reorder levels before inventory becomes waste.
- Fewer stock-outs. By tracking demand and supply trends visually, planners can replenish items before they run short. Industry users report significant drops in emergency orders and production delays.
- Faster, evidence-based decisions. Teams no longer wait for monthly reports. Live dashboards show current performance and support immediate action.
- Better collaboration. With shared Power BI workspaces, warehouse, purchasing, and finance teams use the same facts to plan their work.
These benefits build consistency across the supply chain. Instead of reacting to problems, companies guide operations through clear and timely insight.
How to Get Started with Dynamics 365 Inventory Management and Power BI
Starting with Dynamics 365 Supply Chain and Power BI requires planning, but the steps are straightforward. The goal is to turn existing inventory data into clear, actionable insight.
- Assess your data. Review current inventory records, locations, and tracking methods. Identify gaps, duplicates, or inconsistencies. Clean data ensures reliable dashboards.
- Connect systems. Link Dynamics 365 to Power BI. Microsoft provides Inventory Visibility dashboards as templates, or you can create custom reports using D365 entities.
- Define KPIs. Decide which metrics matter most: days of inventory, stock-outs, turnover ratio, or slow-moving items. Focus dashboards on these KPIs to prevent information overload.
- Build dashboards. Keep visuals clear and grouped logically. Use filters for warehouses, product categories, or regions. Include contextual information, such as costs, lead times, and supplier performance.
- Review and refine. Use the dashboards daily. Adjust reorder points, safety stock, or workflows based on insights. Over time, dashboards evolve with your business, providing reliable guidance for inventory decisions.
Starting systematically ensures that your team can trust the data and act confidently. The combination of Dynamics 365 and Power BI transforms inventory from a passive record into a proactive tool for supply chain control.
Final Thoughts
Inventory management is no longer about guessing or reacting. With Dynamics 365 Supply Chain, every movement of stock is recorded in real time. Power BI turns that data into insight, showing trends, risks, and opportunities at a glance.
Together, these tools give businesses the ability to act rather than react. Teams can reduce stock-outs, lower carrying costs, and optimize reorder points. Managers gain a clear view of slow-moving items, high-demand products, and supplier performance. Decisions are based on evidence, not intuition.
The path is straightforward: assess your data, connect Dynamics 365 to Power BI, define key metrics, and build actionable dashboards. Over time, your inventory processes become more precise, efficient, and predictable.
By transforming raw data into actionable insight, companies move from managing inventory to mastering it. Clear information enables confident, timely, and effective decisions that benefit the entire supply chain.
Table of Contents
Read more
- Top Dynamics 365 Sales Features: Transform Sales Performance
- Microsoft 365 vs Office 365: Key Differences Explained
- Business Central Cloud vs On Premises: Which to Choose
- Forbes Reveals the Best Cloud ERP: Here’s Why Business Central Wins
- How the Microsoft Power Apps Platform Transforms Manual Processes

Top Dynamics 365 Sales Features: Transform Sales Performance


Forbes Reveals the Best Cloud ERP: Here’s Why Business Central Wins

How the Microsoft Power Apps Platform Transforms Manual Processes