What Is BI Dashboard Design?
A well-designed BI dashboard shows you:
What’s happening right now (real-time performance)
How it compares to past trends (historical data)
What needs attention (alerts and KPIs)
And where to focus next (actionable insights)
Who Uses BI Dashboards?
BI dashboards aren’t just for executives. Here’s how different teams benefit from custom BI dashboard design:
- Sales teams track leads, conversions, and sales pipelines.
- Finance teams monitor revenue, expenses, and forecasts.
- Operations teams watch inventory levels, shipping delays, or production flow.
- HR tracks hiring status, attrition rates, and engagement metrics.
- Executives get a high-level view of performance across departments.
Whether you want a big-picture overview or a daily status dashboard for specific roles, we make it easy for every team to understand their numbers and take action.
How It Works
Here’s how Power BI report development and dashboard design come together:
- Data Sources: We connect to your systems: Business Central, Excel files, SQL databases, APIs, etc.
- Data Modeling: We clean, organize, and shape the data to match how your business operates.
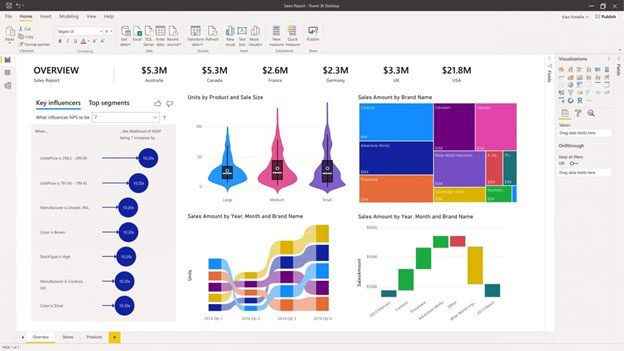
- Visualization: We design reports and dashboards using Power BI or other tools, with visuals that are clear, dynamic, and interactive.
- Publishing: Dashboards are shared via secure cloud access or embedded inside your Microsoft 365 tools like Teams or SharePoint.
- Updates & Access Control: You choose who sees what, and data updates in near real-time.
Your team gets accurate, up-to-date views of performance, without digging through spreadsheets.
Why Custom Reports Matter
Standard reports don’t always show what your business really needs. Generic dashboards might look nice but miss key KPIs, metrics, or comparisons. With custom BI dashboard design, you get insights that actually match your goals.
With Gem365’s custom BI dashboard design, you get:
Visual clarity
Graphs and charts that highlight trends
Data in one place
Bring together finance, sales, inventory, HR, and more
Role-based views
Show different data to different users
Time savings
No more exporting and updating spreadsheets
Business relevance
Dashboards built around your questions and goals
What Can Gem365 Build for You?
Here are some examples of Power BI report development and dashboards we’ve built:
Sales performance dashboards with real-time order and revenue tracking
Inventory dashboards showing trends, reorder points, and warehouse status
Financial reports with custom profit/loss views
Project status dashboards with Gantt-style timelines and milestones
Power BI visuals embedded inside Business Central pages
Let’s Visualize Your Business
Stop making decisions in the dark or drowning in spreadsheets.
Let Gem365 turn your data into custom BI dashboards your team will actually use.
Why Choose Gem365?
- Microsoft Data Experts: We work across Power BI, Business Central, and Excel
- Costumized for You: Every dashboard is custom-designed
- Secure & Compliant: We apply proper permissions and governance
- Clear Communication: We explain metrics and filters in plain English
- Flexible Support: Need edits, upgrades, or new metrics later? We’re here.
Whether you’re new to dashboards or need a full reporting overhaul, we’ll meet you where you are.